How To Use Trend Lines in Trading - Practical Example with Cryptocurrencies
TABLE OF CONTENTS
Former US President Bill Clinton once said, "Follow the trendlines, not the headlines". Clinton probably meant that actions should be based on long-term trends rather than the sensational news of the moment.
Although Bill wasn't necessarily talking about the Trend Lines used in the trading world, the principle still applies. For traders, the ability to identify trends that develop over time and then formulate effective strategies is an invaluable skill.
Trend Lines are one of the best-known and used indicators in technical analysis. Perhaps what favors their popularity is their simplicity; Trend Lines are simple lines drawn on the charts to highlight market trends.
In this article, we will explain what Trend Lines are and how they work. In addition, we will see how to use them concretely in a trading strategy focused on cryptocurrencies . Based on this example, we will draw some conclusions about their real usefulness within a systematic trading strategy.
What Are Trend Lines
As the name suggests, Trend Lines are lines drawn on a chart that use different points of support or resistance, and are used to identify the general direction of prices.
When the trend is bullish, lines will have an ascending angle. When the trend is bearish, the lines will be descending.
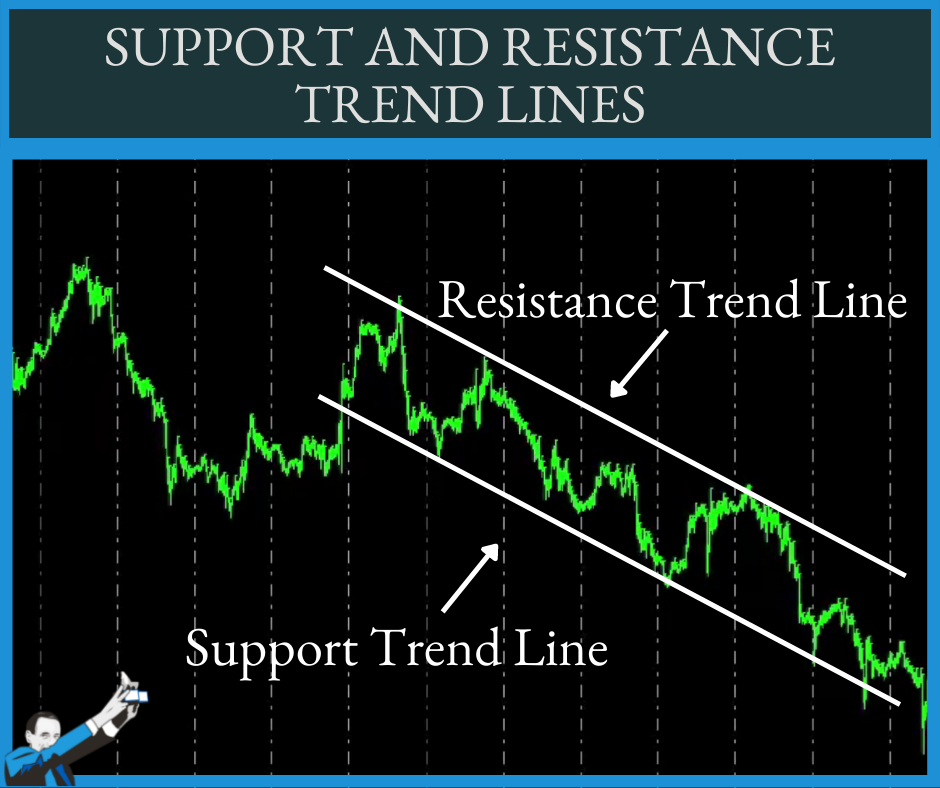
Setting up these lines can be very helpful in identifying which operations to perform. In technical analysis, you usually buy on the supports and sell on the resistances. Alternatively, you may keep the positions open to take advantage of a trend until it finishes.
Therefore, understanding and using Trend Lines correctly helps traders identify the best opportunities to open or close their trades by finding the correct support and resistance levels.
This approach is most useful in markets like currency futures, where prices tend to move like a ping-pong ball within a trading range.
Trend Lines in Systematic Trading
So far we have talked about Trend Lines in the field of discretionary trading. Now we will focus on systematic trading, that is, the approach that we use and teach at the Unger Academy to be profitable in the markets without spending hours and hours analyzing the charts in front of the screen.
In general, Trend Lines lend themselves to mean-reverting strategies that are based on the assumption that prices, no matter how many fluctuations they may have, will always return to an average value.
But as mentioned at the beginning of this article, we want to offer you an alternative use of Trend Lines. In the video below, we show a trend-following breakout system based on Trend Lines.
This system works on Ethereum, the second most capitalized crypto in the world, and seems to produce encouraging results. If you want to skip the introductory part and go straight to the practical example, start watching the video from minute 2:20.
As you can see, the system shown in the video only opens long positions. This is because the underlying trend of cryptocurrencies is bullish and making profits by short trading these markets can be pretty complex. The system opens a long position each time the price, breaking a dynamic resistance, signals that its bullish run could continue.
The system is backtested on Ethereum using data that starts in 2017. This is the backtest equity line.
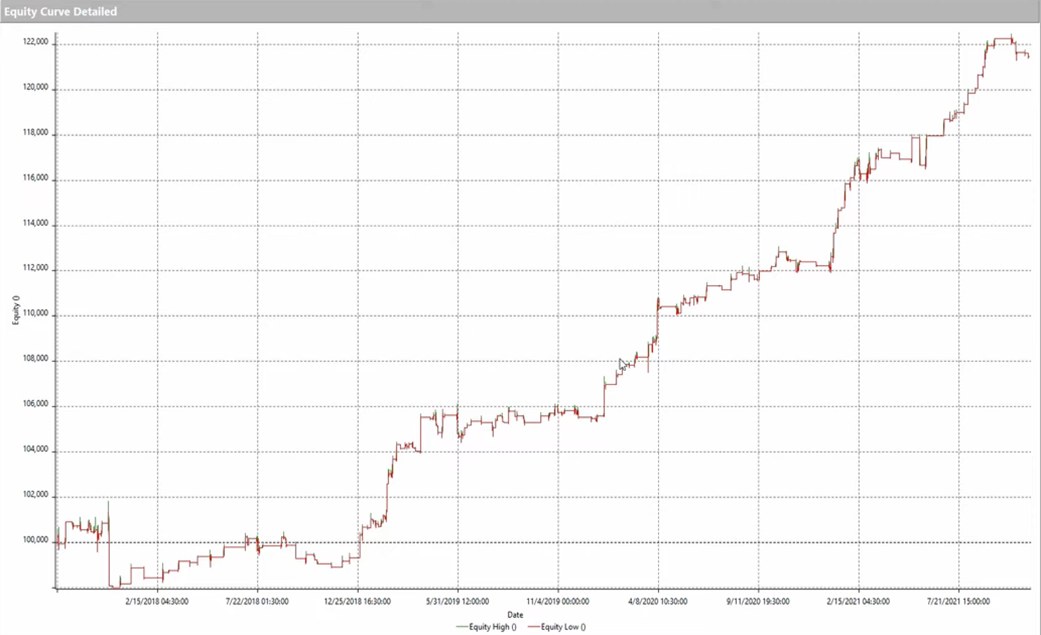
As you can see, it is undoubtedly an interesting curve, especially if we compare it with that of a Buy & Hold strategy of the same asset (of which you can see a snapshot below).
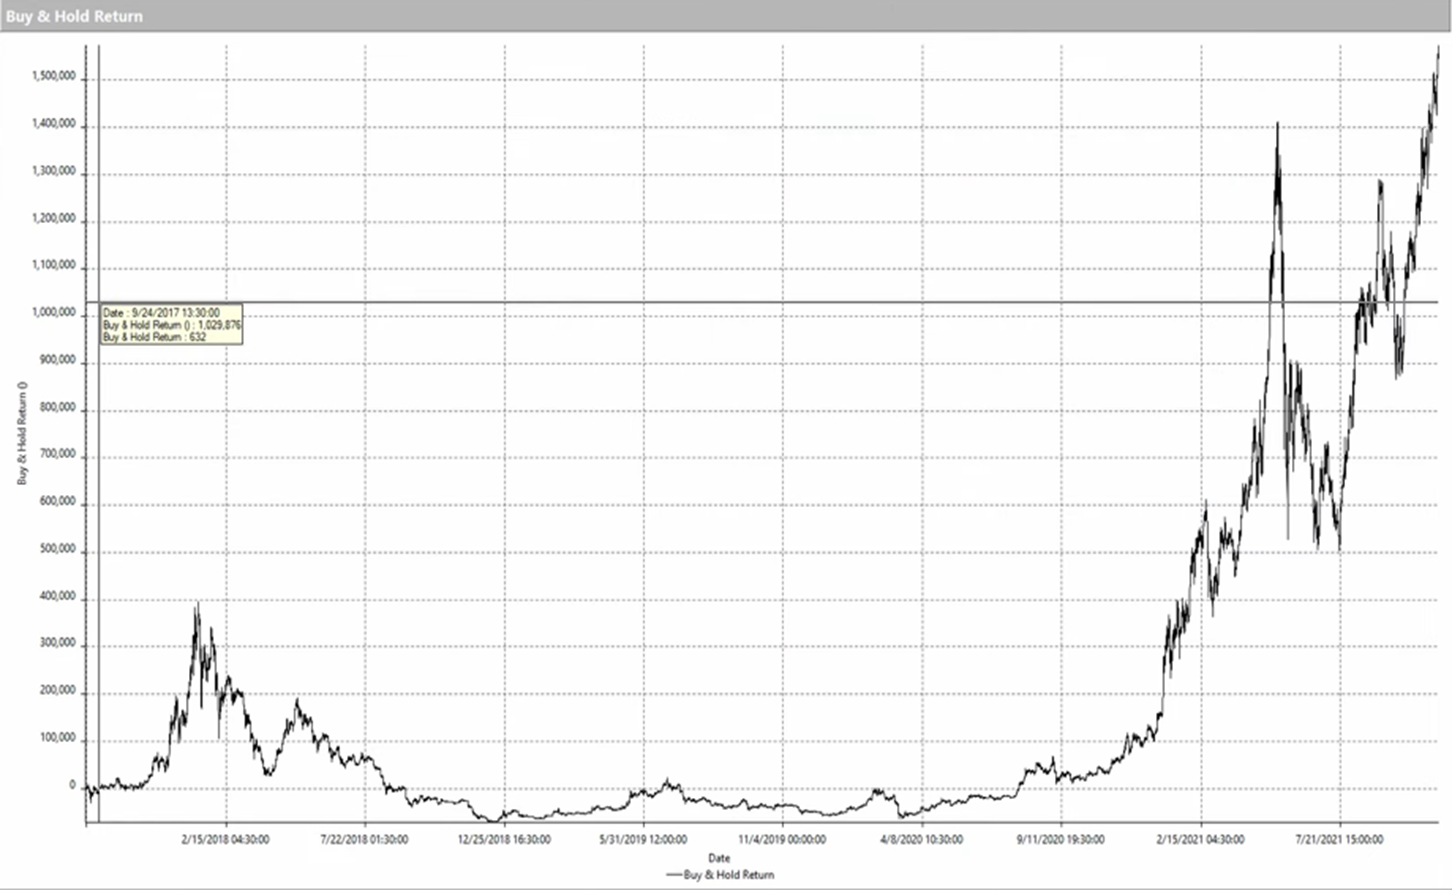
Faced with these results, it would be easy to claim victory and decree the undoubted effectiveness of Trend Lines in crypto breakout strategies. However, as shown in the video, this success is probably due more to the characteristics of the market itself than to the real effectiveness of the Trend Lines.
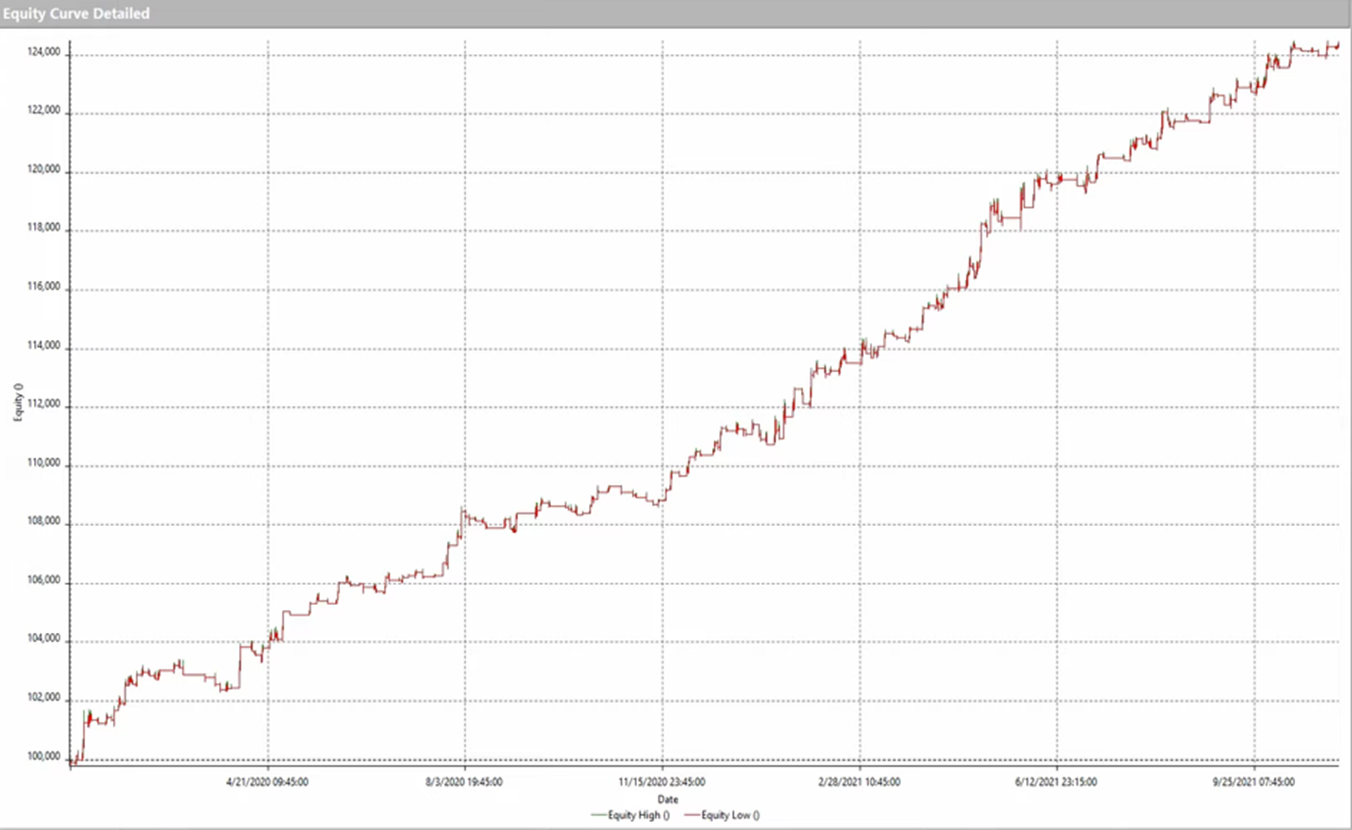
To see much better results, compare the equity line of the Trend Line trading system with that of a simple trading system that buys at the breakout of the previous day's high (and applying some filters of the Unger MethodTM). If you want to see the live explanation, watch the video above starting at 7:17.
Conclusions
For a trader, it can be very useful to know and understand how Trend Lines work, as they are one of the most used indicators in technical analysis.
However, like other indicators, Trend Lines are not a perfect tool and are far from an exact science. Oftentimes these strategies only work in retrospect.
As for its application to systematic trading, although it certainly plays an important role in some strategies (especially mean reverting), our advice is to always test the different setups and compare various scenarios.
In this way, you will be able to objectively evaluate whether the use of an indicator offers a real competitive advantage to be exploited, or if it only complicates things, as in the example shown in the video.

